How much of a black box are Performance Max campaigns and can we optimise them at all? In this short article, I’ll share some useful reports and how to find out what’s happening inside Google Ads’ new flagship campaign type. Read on to find where to view asset group performance and search term reports in Performance Max campaigns.
Update! I originally wrote this post in 2022 when pMAX was a newly launched campaign type. Nothing stays still in the digital marketing landscape. Currently (February 2024) there have been some major additions to help track performance max asset group performance. I've now added them to this article.
Before we dive in, it’s important to note that Performance max campaigns are evolving and new reports and features are supposed to be rolled out. At the time of writing, reporting is limited but it still exists.
Google love to hide meaningful data one step away but it's there. You can now view asset group performance directly by switching to column view inside the asset group tabs, in your pMAX campaign.

You'd need to switch from the default 'summary view to table view if you want to see how your asset groups actually perform.
Once you've switched to table mode you can arrange you columns to show meaningful data, just like you would comparing ad groups ( I wonder why they didn't just call them ad groups to begin with?). You can also change the date range to view historical performance. They only thing you cannot do is set a date comparison range (eg last 30 days vs pervious period or year on year).
Viewing this level of data gives us a lot more power as digital marketers to understand what's working, what's wasting our budget and how to further improve a campaign's performance.
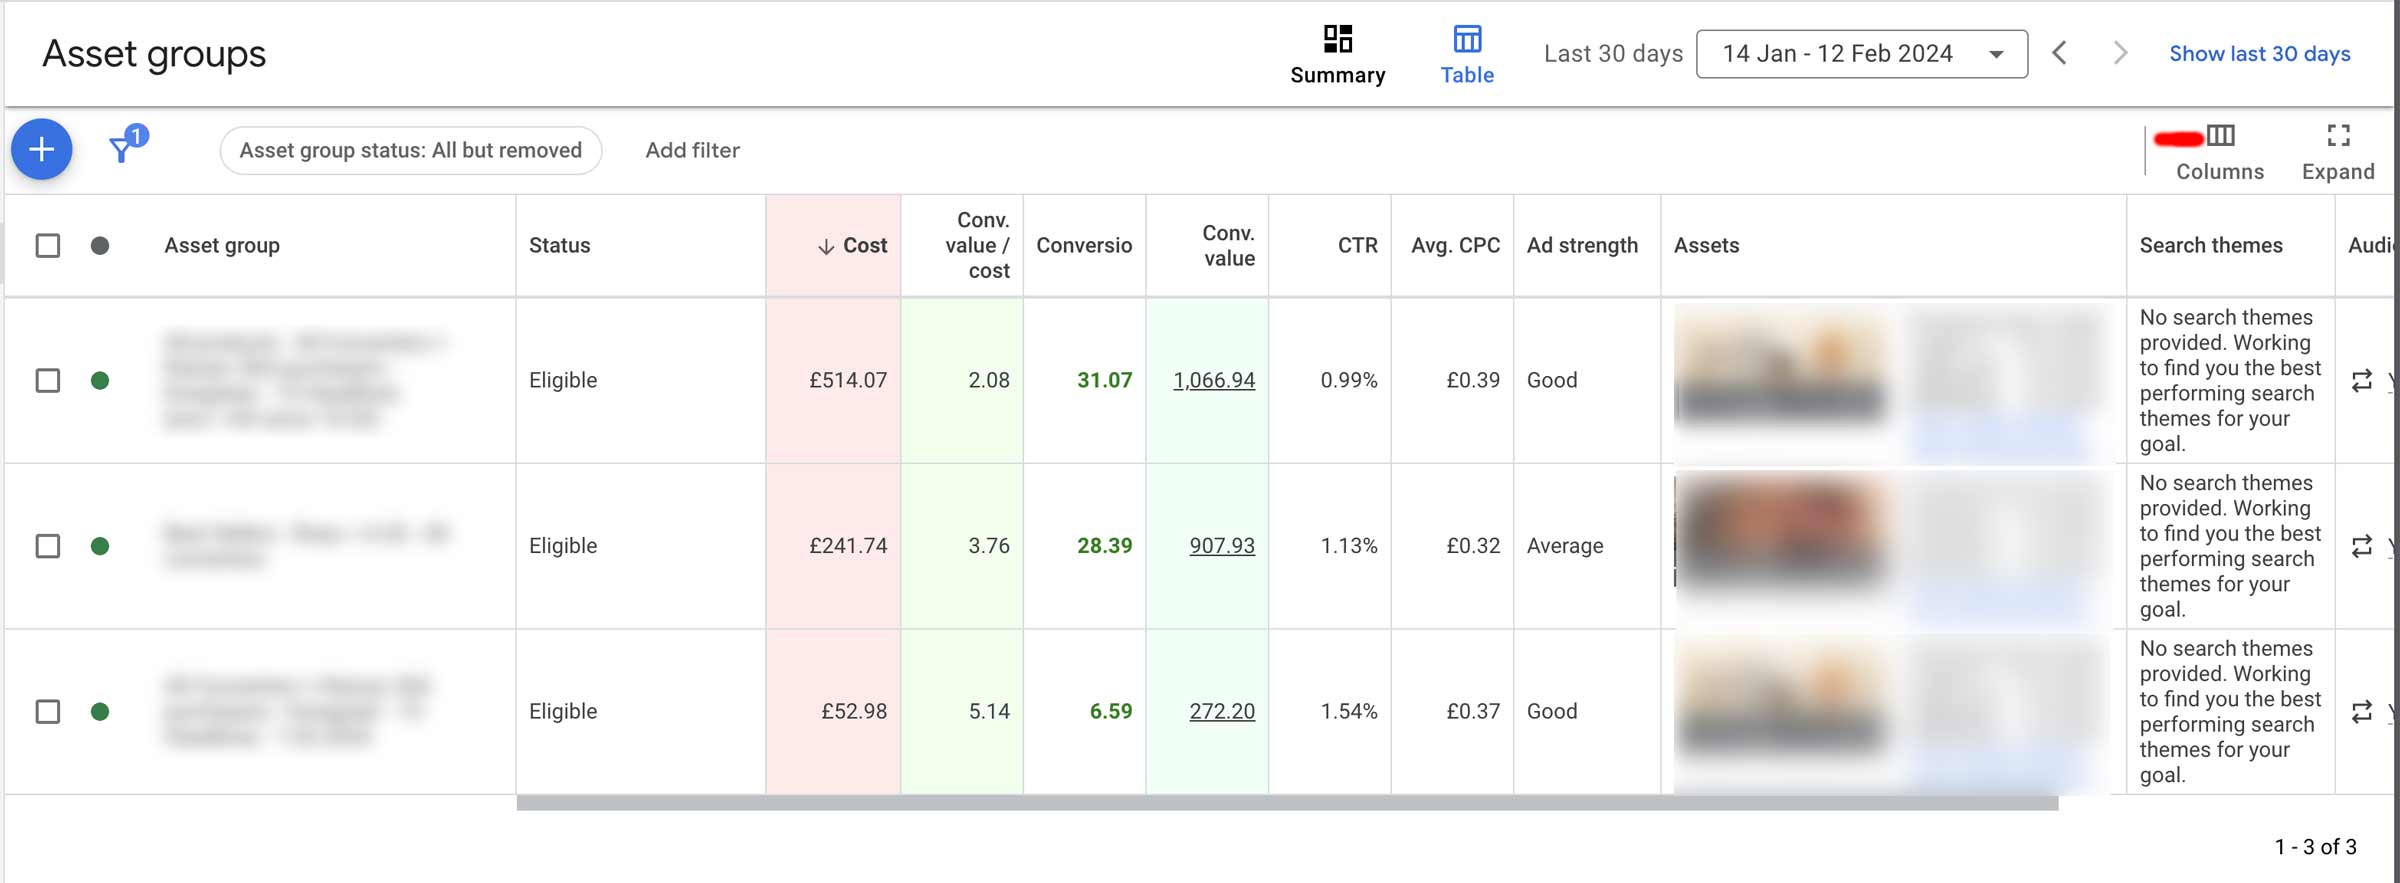
In this example, I can clearly see the asset group with the largest spend is also bringing in the lowest ROAS (return on ad spend) so I can take action and improve the campaign's overall return.
You might have noticed that I didn't look at cost per conversion in the above example. This is because with ecommerce accounts, I tend to focus on the return on spend. Some products might have a higher CPA (cost per acquisition) but also higher value. ROAS (return on ad spend) is my north star when I optimise ecommerce accounts in Google Ads.
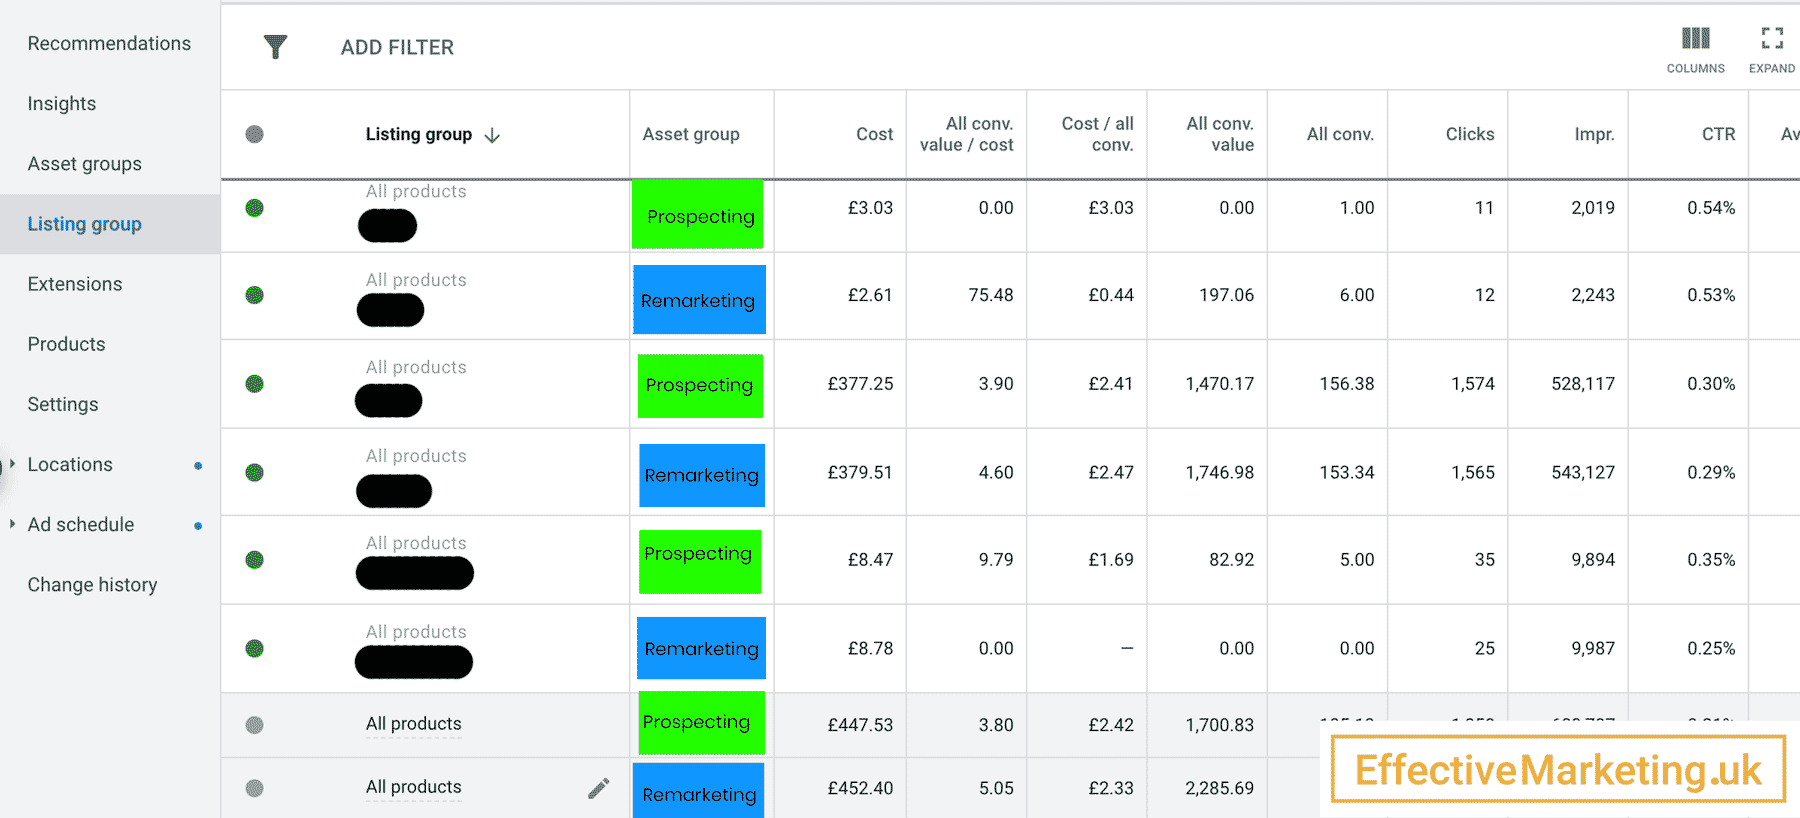
Note! This is an older technique I used before performance max allowed viewing asset group performance with an actual report. I've kept it in the post because it can sometimes be useful to view and compare listing groups, which are the feed based part of your asset groups (the products being served in shopping ads and dynamic remarketing).
Asset groups are a bit like responsive search ads and responsive display ads mashed together. An asset group gets attached to an audience signal, which is how you target your ads. You can use them to send different messages to different audiences. So they’re very similar in function to ad groups. But what use are they if you can’t see their individual performance? The good news is that you can view asset group performance if you’ve added a product feed to your campaign.
To view asset group performance, go to the Listing group tab. Here, besides seeing your different product groupings you can also see asset group performance.
I ran two asset groups. One for remarketing audiences and one for new customers. As expected, remarketing had higher returns but the ads targeting new users are doing well too. (I've masked all client information).
If your Performance Max campaign doesn’t have a product feed then you won’t have a Listing group tab and you won’t be able to access this report.
Performance Max campaigns can do their own thing and spend your budget on search ads and other static ads. If you've got a feed attached to your pMAX campaign, you're probably expecting most of the budget to go towards shopping ads. But this isn't always the case and you can uncover where the spend is going with this technique.
The 'Campaign overview' tab shows total cost and conversions for the campaign. You can change conversions to conversion value. If you compare this with the 'Listing group' tab, you can also derive how much of your spend and conversions are coming from feed based advertising in your Performance Max campaigns. Feed based ads would include shopping ads and dynamic display and discovery ads. Admittedly, it’s a roundabout way of gathering data but we have to pick whatever crumbs of data Google Ads has kindly left us.
Budget not spent on products must have been spent on the general ads created with the images and text you’ve added to the asset group. This can also help us understand if our brand terms are spending on search or shopping ads.
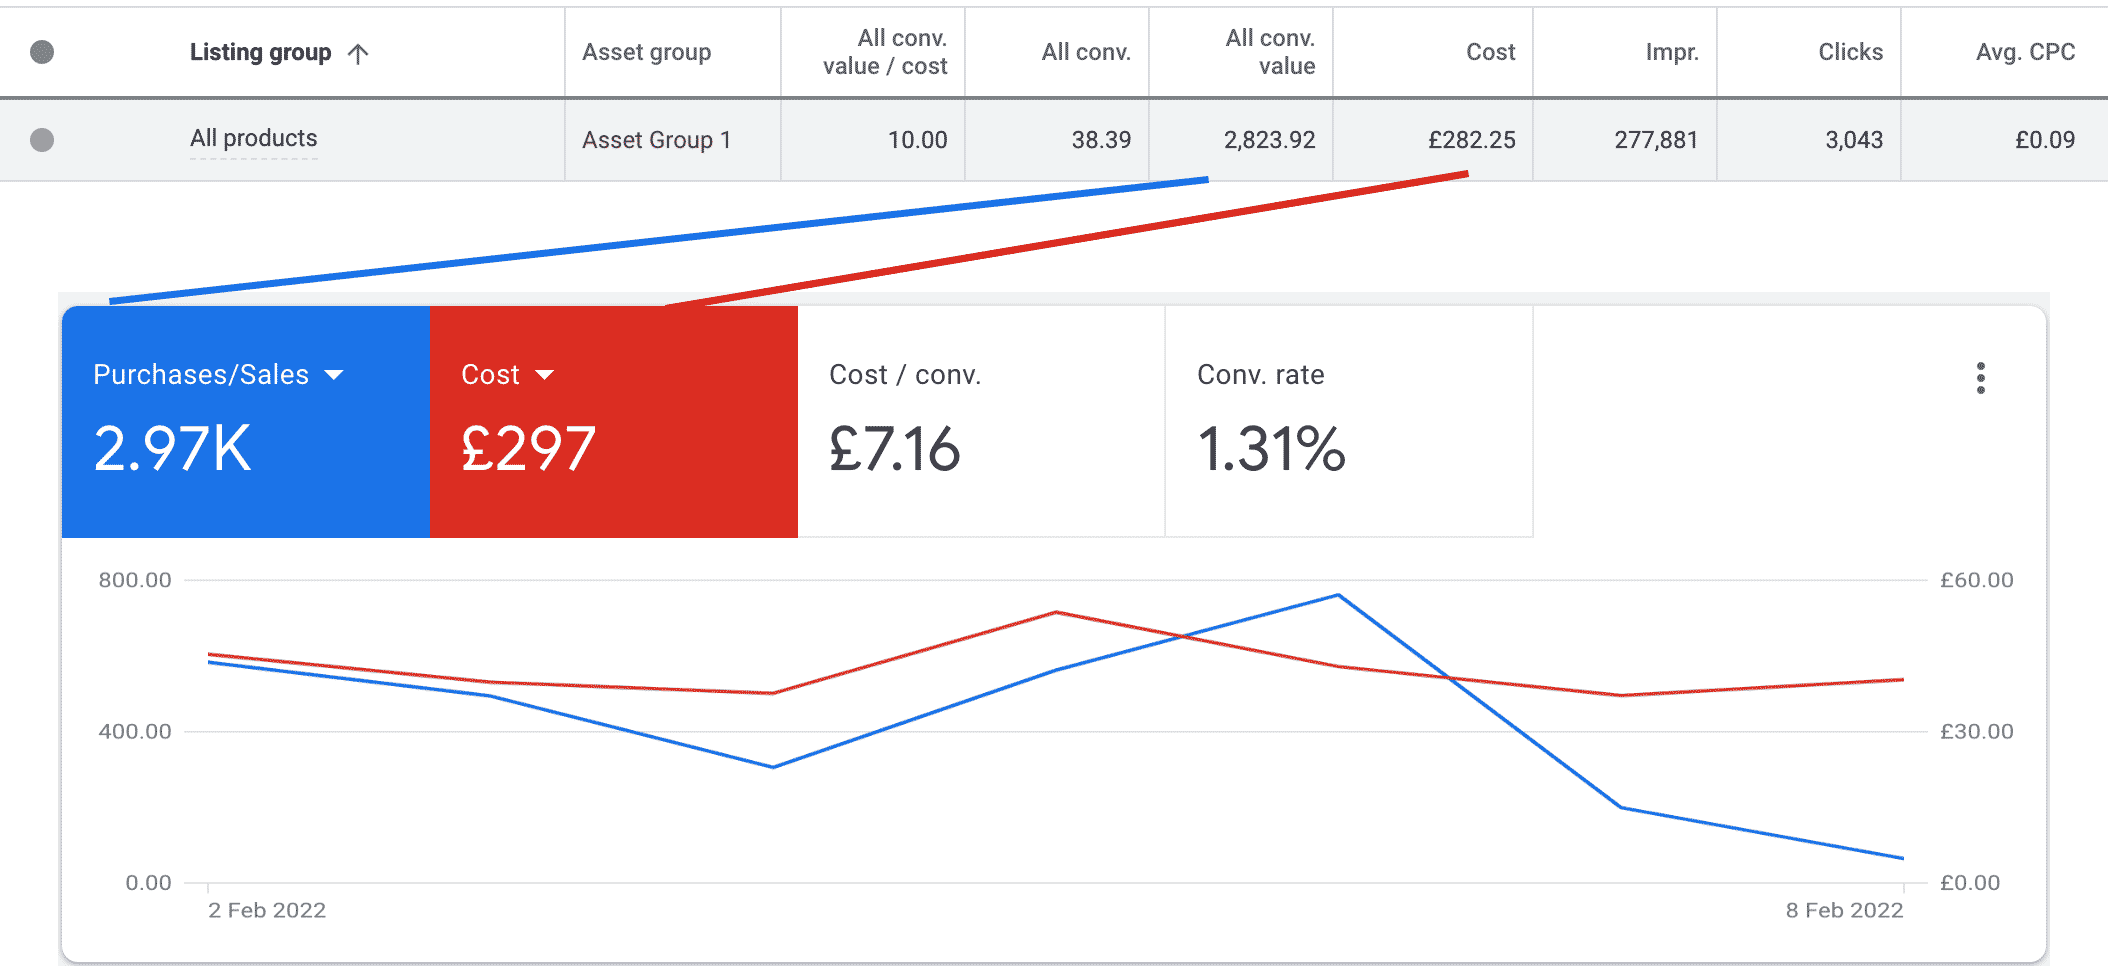
We're comparing two separate reports here: Listing group and Campaign overview. In this account, the vast majority of the budget went to product feed ads and only £15 went to non-product ads.
Search terms begin to appear in your pMAX campaigns about a week after they're running. Originally, you could only see the last 7 or 28 days broken into categories. You can click on the little triangle next to each category to open it up and very actual search terms.
A new addition is the option to view a detailed report (Google's classic way of hiding data deeper than it needs to be) or even better, you can download the search terms to a spreadsheet. I prefer to download it to a Google sheet where I can filter the data and find meaning.
Unfortunately, Google doesn't allow us to edit the columns in the detailed search term report or while exporting. We cannot see cost per search term but we can see clicks, conversions, conversion value. It's a huge improvement on the old black box but still of what a normal campaign would give you.
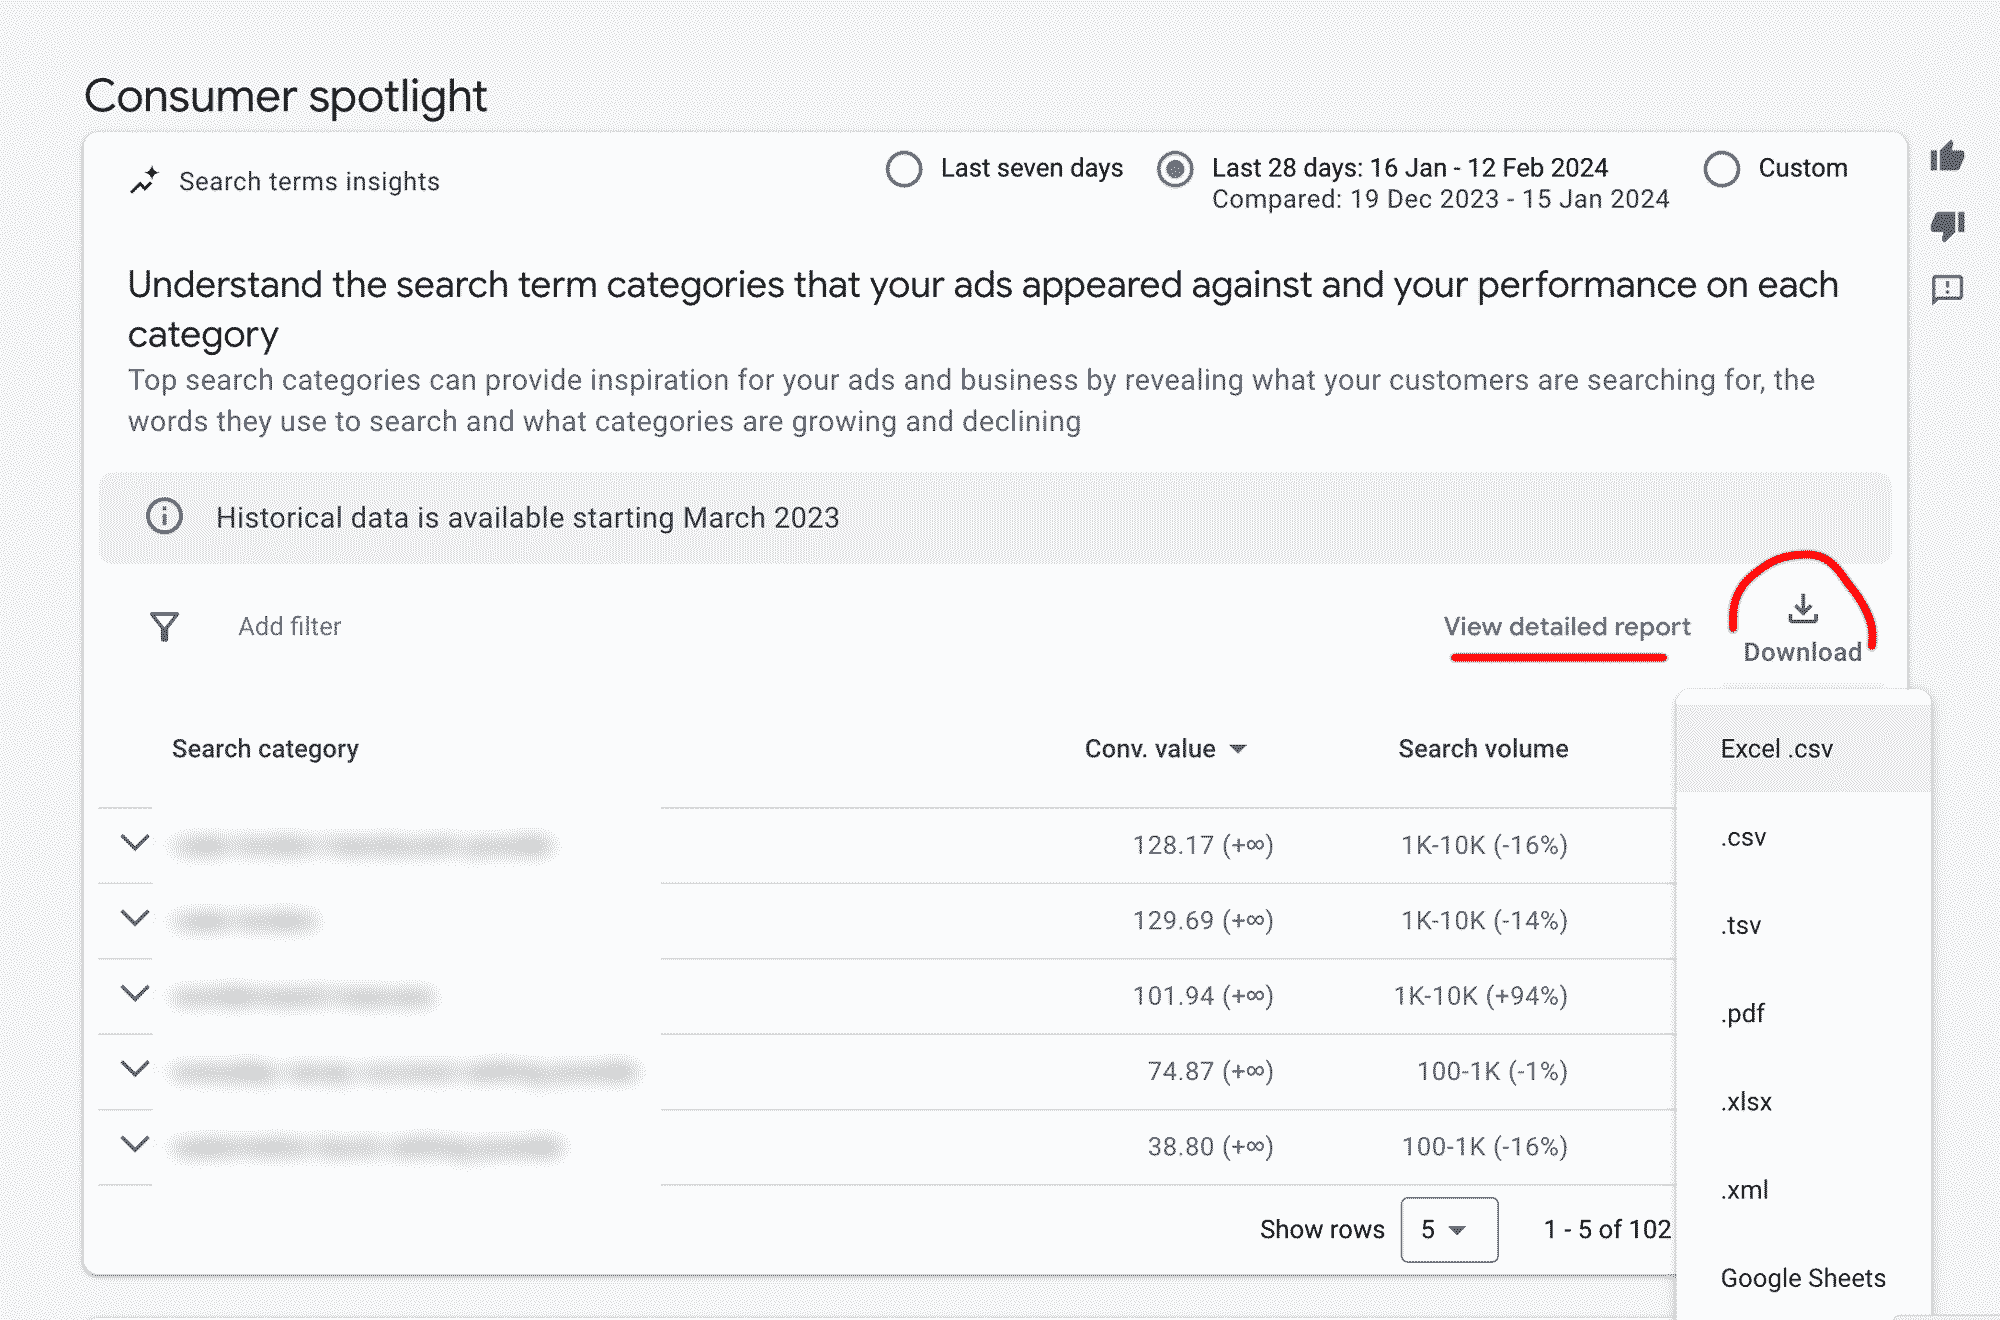
The search term report in Performance Max campaigns now has the option to view any time period, change to a detailed report or export to a spreadsheet. Happy days!
Inside the 'Insights' tab you can view search terms your campaign has shown for. The search queries are bundled into themes and you can expand each theme to view more search terms. I’ve found this report useful. I helps me see if brand terms are a big factor in the campaigns budget and revenue. Since Performance Max campaigns also show on search, I don’t want them to compete with brand campaigns, which usually have a very high return.
One slight annoyance with the insights tab is that you can only view last 7 days or last 28 days. You can view historical data. It's better than nothing but still very limited compared to normal campaigns.
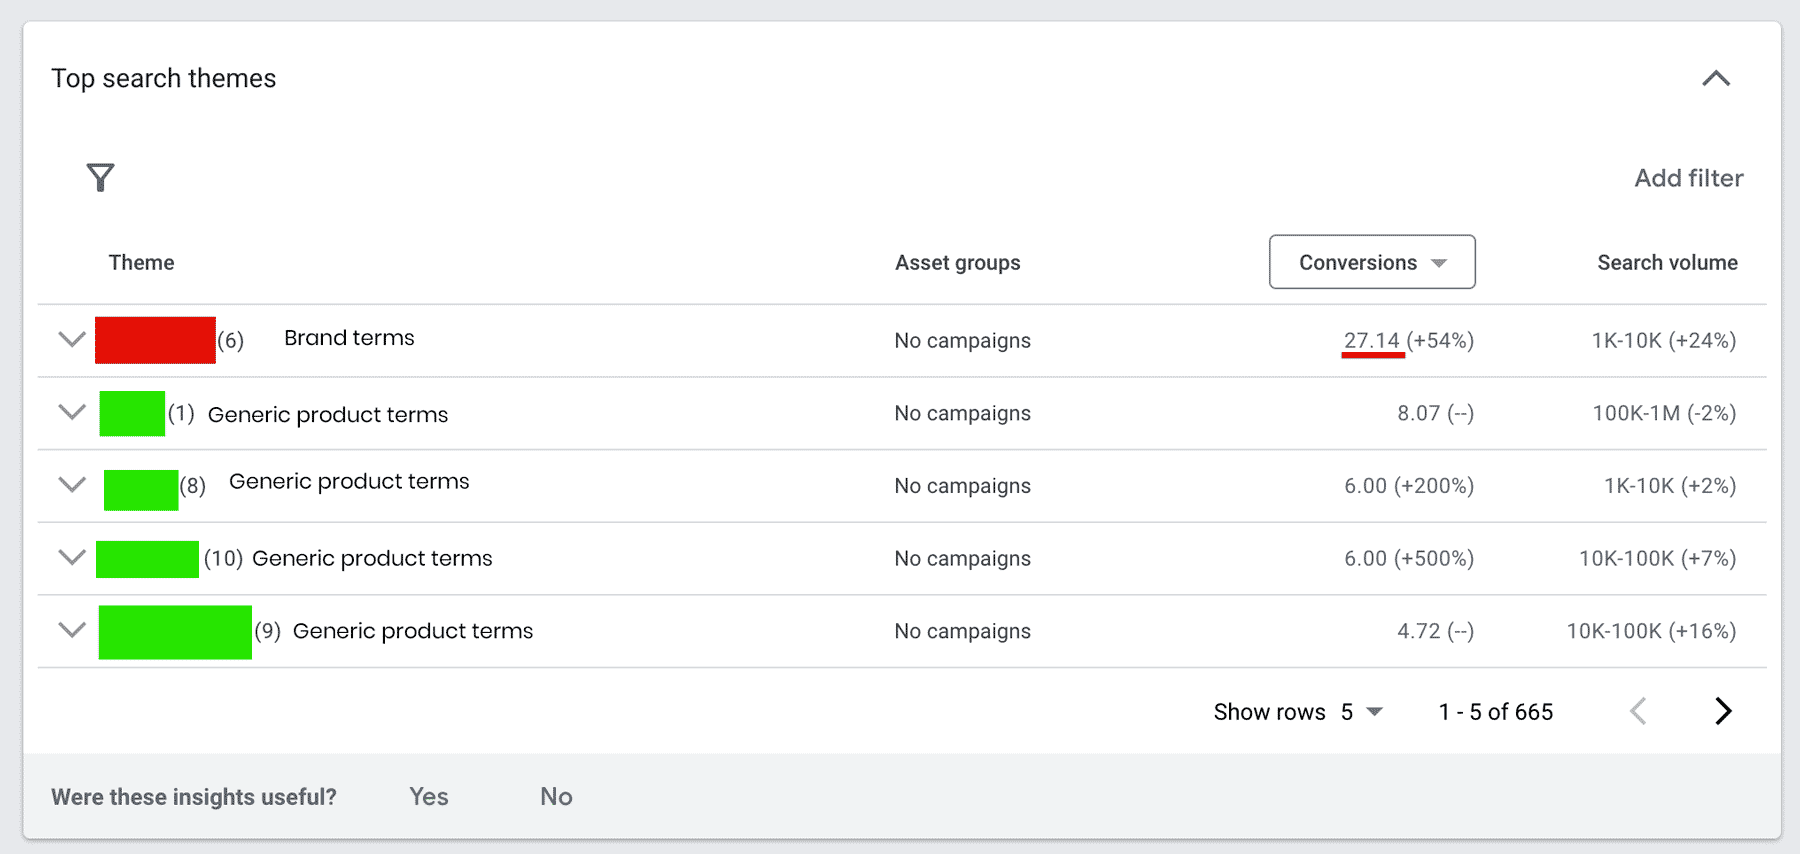
For this campaign, most of the conversions are coming from brand terms (I've masked the actual terms). This is a scenario where pMAX is just taking easy conversions from people already searching for the brand.
I’ve found the amount of brand terms being targeted by Performance Max campaigns to vary from each account. Most ad accounts I've managed have had a low percentage of brand terms but for one client, the brand terms are the biggest cause of conversions (not good!). Performance Max campaigns without a product feed have rarely delivered any good in my accounts and have mostly acted like an overpriced brand campaign.
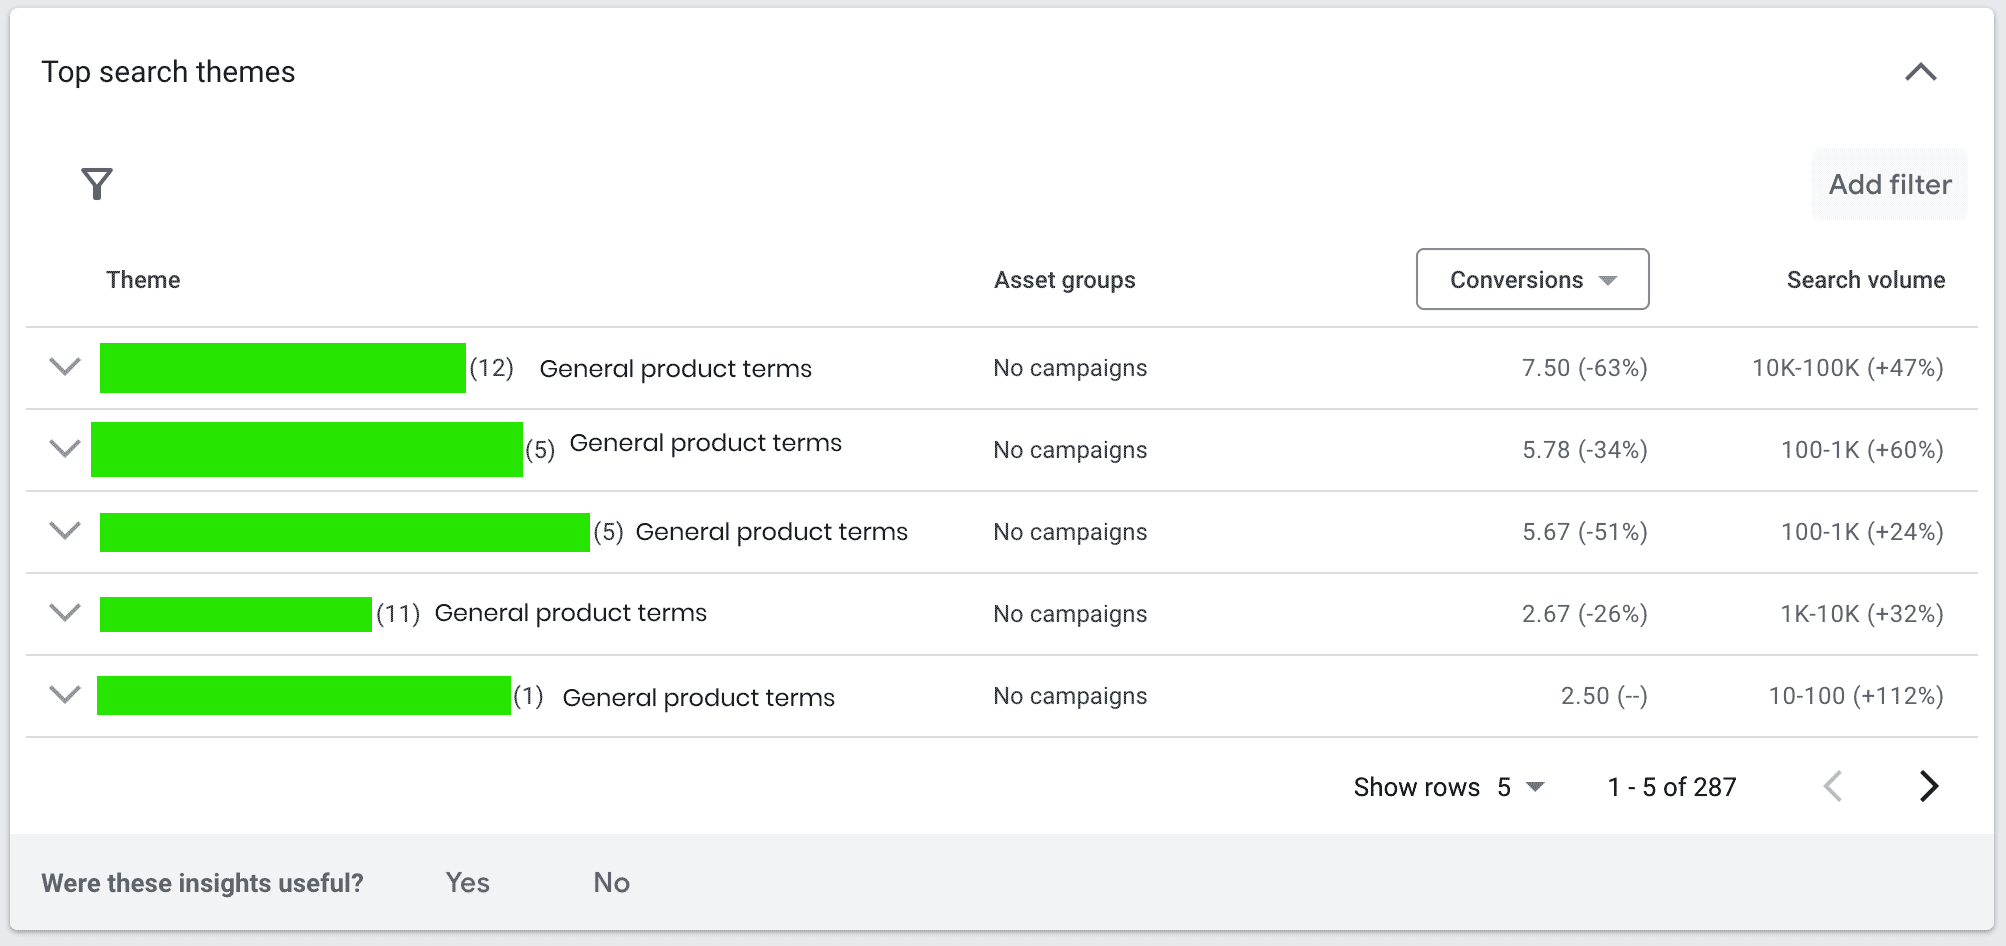
This lead generation account has not had any brand terms and all search terms (masked) were very good. Update, after running for several months, this account is showing more brand terms than it did in the beginning and I've had to reduce its budget.
On some accounts, I've managed to ask my Google Ads rep to add a negative keywords list to all our performance max campaigns. This helped us remove brand searches from pMAX. It seems like a very convoluted way to perform such a basic action but worth trying.
There are rumours about this report being available but I can’t see it in any of my accounts. I suspect it’s been rolled out in the US first and can only hope to get access to it soon. If you have access to placement reporting please let me know.
Update, since writing this article, placement reports have not rolled out and I suspect they won't be coming out either.
This post was originally written when pMAX was a relatively new campaign type. By now (February 2024) Performance Max campaigns are the main driver in most of my ecommerce accounts. They also work well in one of my lead generation ad accounts, but not in others.
The black box has opened up and we can see a lot more data than we used to including search terms in more detail, asset group performance and product performance. This allows testing of difference audiences and creatives as well as applying negative keywords, which still requires the help of Google support.
pMAX campaigns can be frustrating to manage at times, especially at scale when we manage large ecommerce accounts on Google Ads. However, they are decent performers and the backbone of any product feed based marketing in Google Ads.
I'm a Google Ads consultant and digital marketer. Together with the team at Effectivemarketing.uk, a London based PPC agency we help companies increase revenue with Google Ads. We work with eCommerce PPC accounts as well as lead generation. I hope you've found this article useful. If you have any comment or if you need any help with Google Ads, fill the form and get in touch.
Odi Caspi
EffectiveMarketing.UK