
Nobody likes a high cost per click (unless they’re a Google shareholder). High CPCs mean more spend, less clicks, less conversions and generally worse performance in.
Sure, some clicks will naturally be more expensive than others and some industries have exceptionally high CPCs. But if you’re expecting clicks at a certain cost, then how come some clicks can cost more than x11 time more?
Question: How do you monitor your CPCs?
Answer: You look at your average CPC column. Wrong answer!
Averages are great, but they do not show the what happens with individual clicks.
Like the name suggests, the average CPC is simply the average cost per click you had for that element in your account. However, it doesn’t tell you the full story of what’s actually happening under your nose.
Intentionally or not, Google is hiding ultra high CPCs below the radar of most advertisers, and your average CPCs won’t flag these.
The trick to finding the closest version if your full CPC spectrum is segmentation. While for most analysis you want to look at large datasets and averages to gain meaningful insights, to find the spikes and anomalies you need to break your data as much as possible.
We’ll look at the most granular element in the account, search terms, and segment them even further to make sure we are seeing as many individual clicks as possible.
Google Ads’ report editor allows us to create a custom search term report with many metrics and dimension to expose ultra-high individual costs per click.
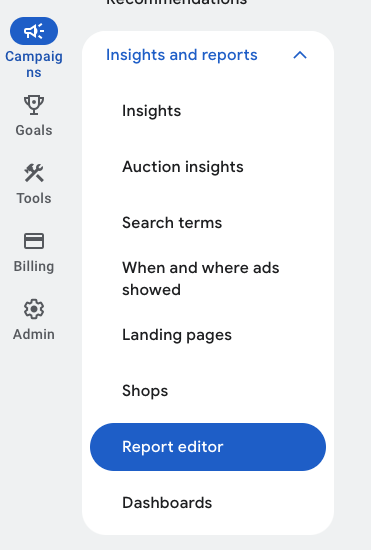
Step 1 - Go to the report editor in your Insights and reports tab.
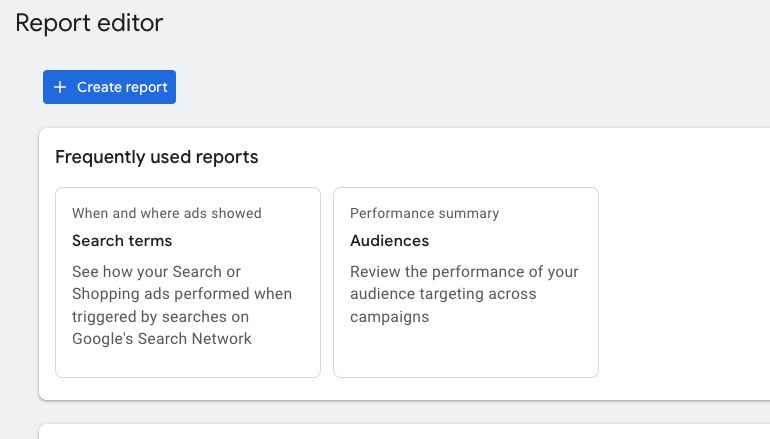
Step 2 - Create a report and give it a name “CPC spikes” or anything you like.
(if you’re not sure what a dimension or a metric is, don’t worry, simply search for the following items and add them in the report.
Note: The reason we are adding so many dimensions to the report is to segment each click as much as possible. We’re not necessarily interested in all of the information in this report. We’re trying as many individual clicks as possible and avoid averages.
Add as rows
Add as columns
Because we're segmenting by day, you can look at the long period of time and still see singular click costs. I recommend looking at the last 90 days, but depending on the size of your account you might want a shorter or longer period.
Arrange your report by Avg. CPC descending, you should mostly see singular clicks. This is the most granular view we can achieve in Google Ads.
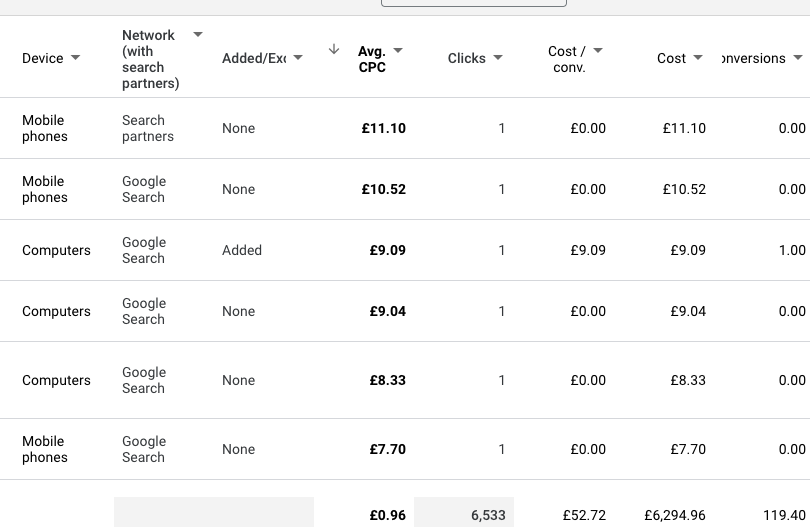
The most expensive clicks are more than x11 times higher than the average CPC in this account!
The most important thing to figure out is how these ultra high CPCs are affecting performance.
While being charged more than x10 the average CPC is frustrating, if these ultra high clicks are generating conversions at a good CPA then happy days.
To find this out, we’ll use filters.
To find how cost per click affects cost per conversion we’ll apply a filter to the CPCs. Instead of clicking using the main Filters in the report, click on the little triangle next to Avg. CPC.
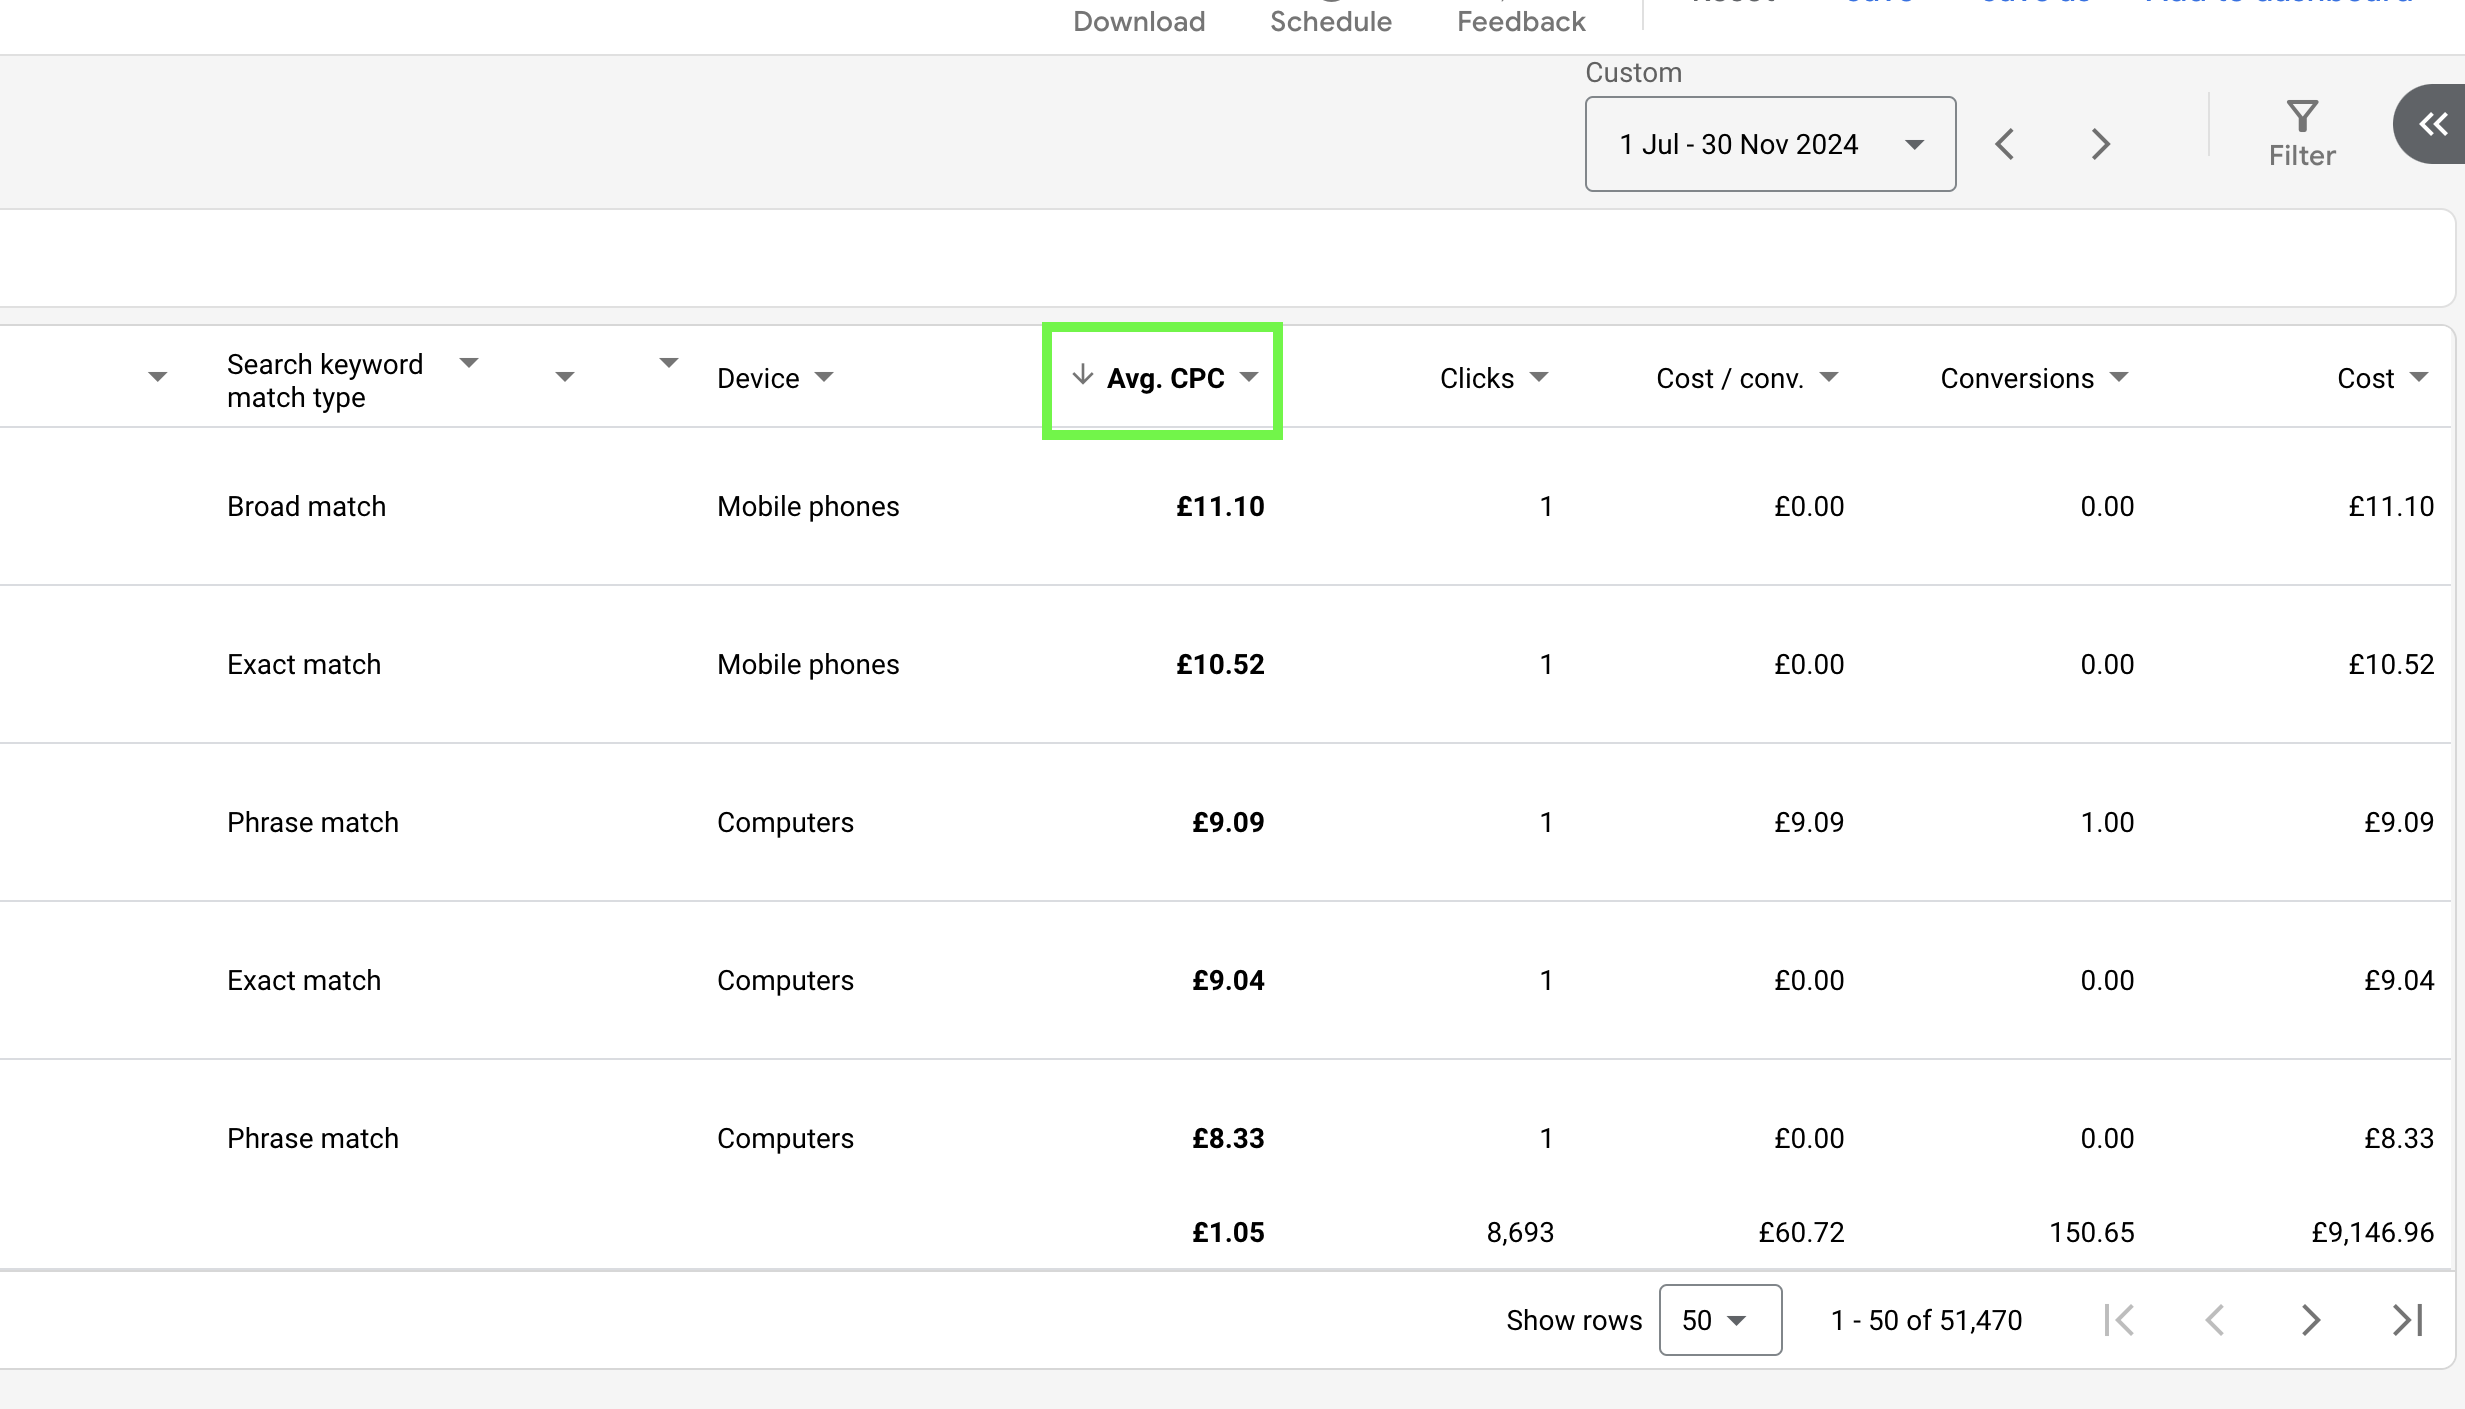
The CPC filter isn't inside the report filter. It's hiding at the top of the Avg. CPC column.
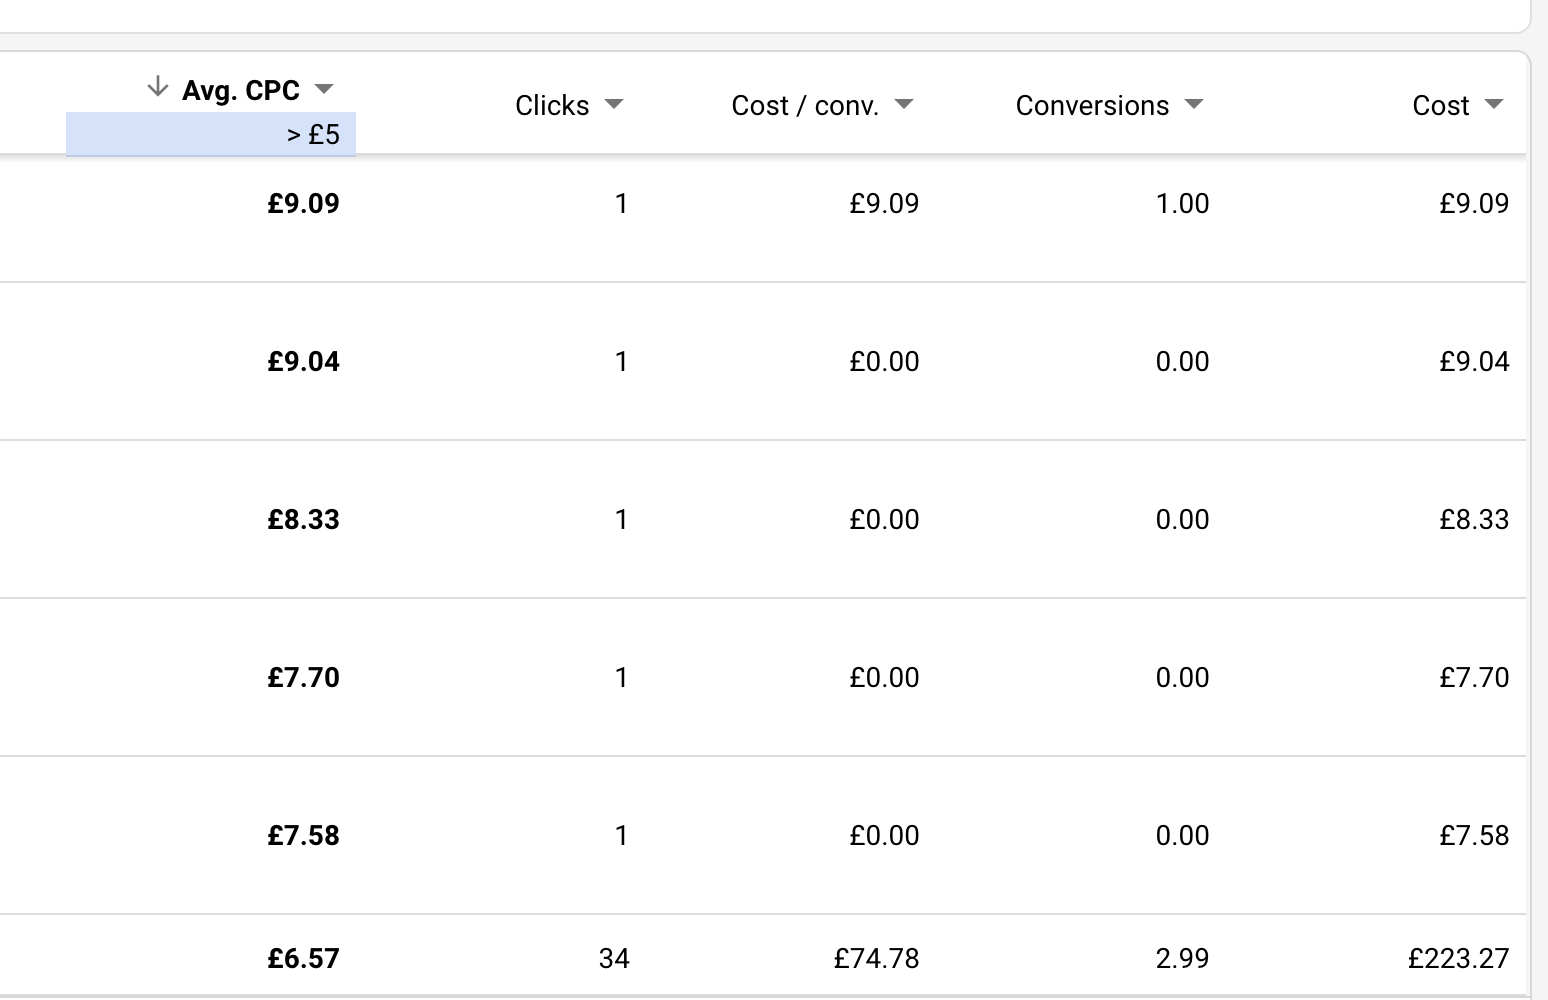
Here, you can apply a filter for CPCs over or under a certain amount. I recommend starting with a random cost, for example: Filter by CPC > £5 and see how this affects your cost / conversion. Then try £4, £3 etc…
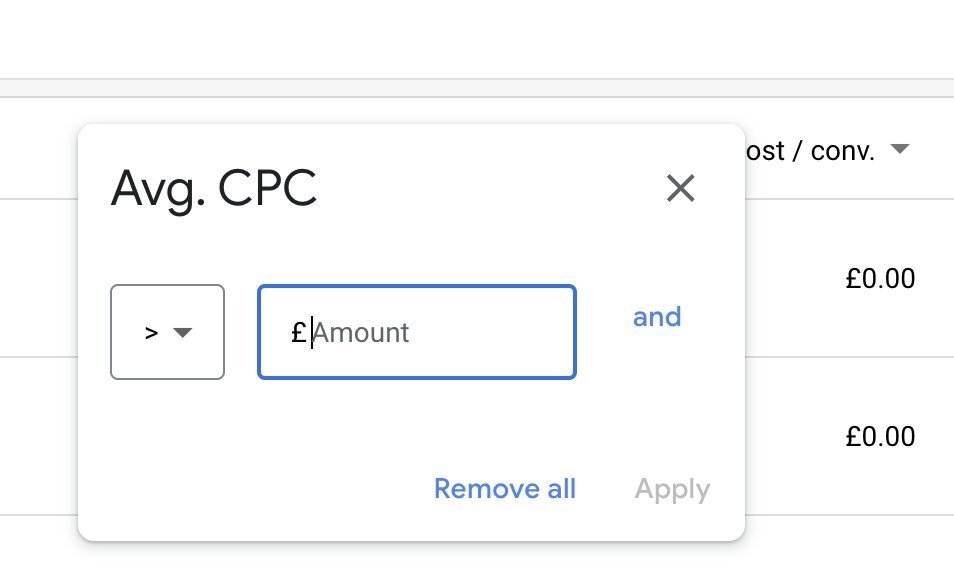
Set a filter on CPCs to find how certain costs per click affect your account performance.
Tip: In most accounts, CPC spikes only take a small part of the spend. It’s easier to view how they affect your account by looking at CPCs over a certain threshold than looking at those under it.
When deciding on a CPC cap, you need to consider both the cost / conversion but also the number of conversions. You might be able to lower your CPA but how many conversions will you potentially lose? It’s better to be cautious and not set a cap that excludes more than 10% of your conversion volume.
In the example account we’re checking for this article, setting the CPC cap at £5 would only lose 3 conversions with a CPA of £75 each.
Setting a CPC cap at £3 would lose 18 conversions with a CPA of £68.
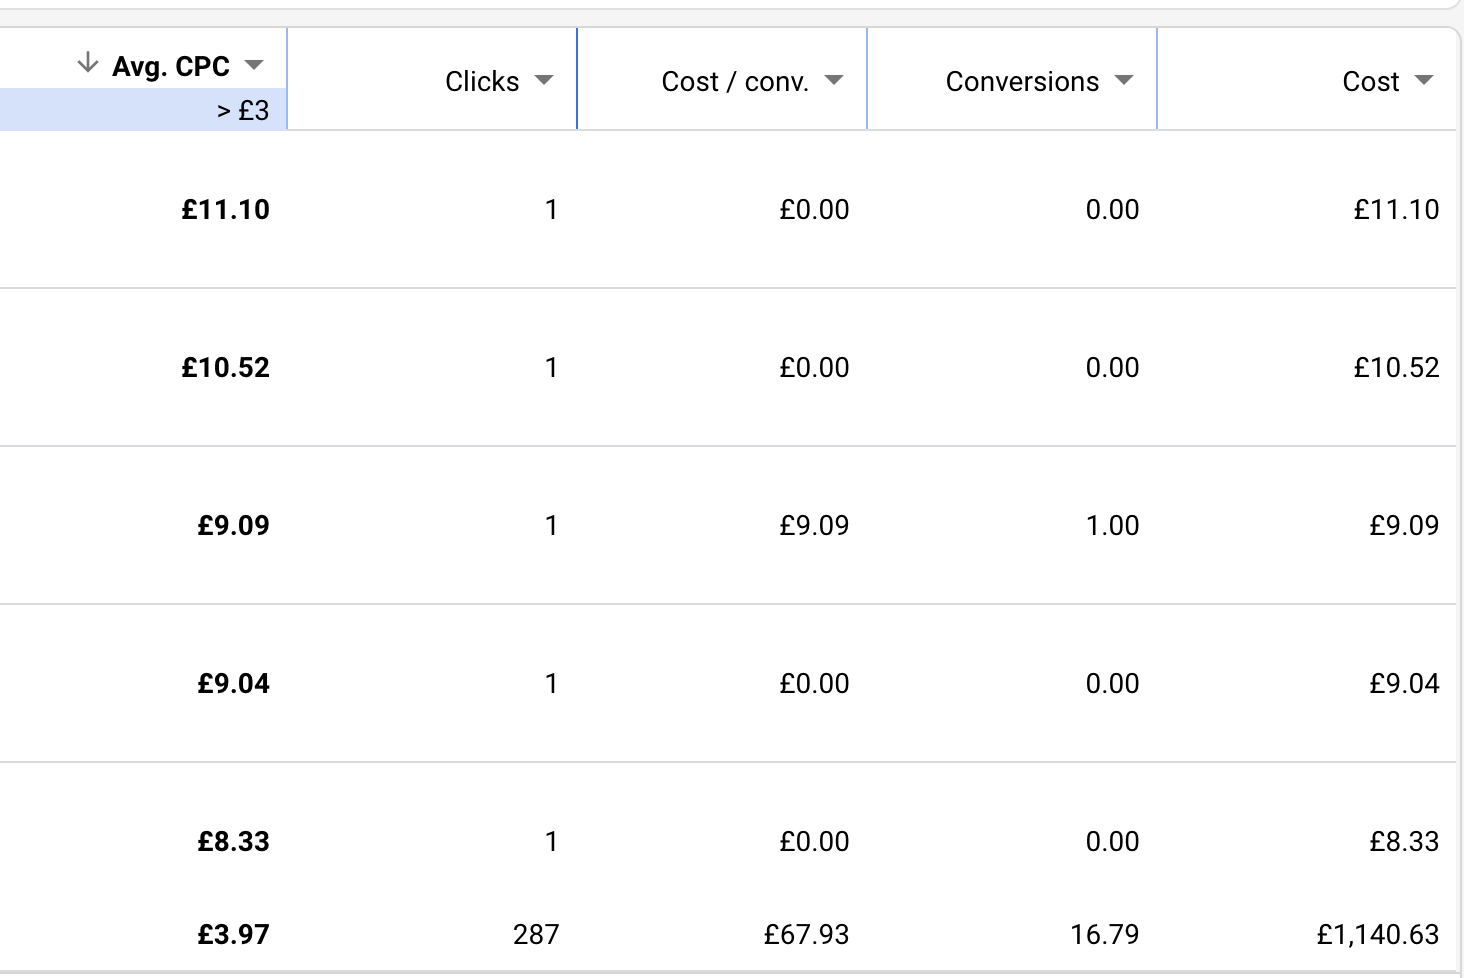
When we compare this to the 150 conversions across all CPCs that had an average CPA of £61, capping at £5 initially seems like a sensible and safe option which we could later follow with a CPC cap at £3.
Yes, we’ve written a guide on how to cap CPCs with automated bidding using portfolio bidding in Google Ads.
As expected, performance Max is not available for bid caps, nor can we analyse the search terms of PMAX in the same report.
Most PPC accounts get surprisingly high clicks on occasion. While the effect on overall costs and conversions isn’t huge, this can case significant wastage over time. This spend could probably be used to get more conversions at cheaper costs.
If we segment down to individual clicks, on each day, we can learn more about these abnormally high CPCs and find the correct level of CPC capping for cheaper conversions.
We're a Google Ads specialist PPC agency based in sunny London, UK.
Our clients include ecommerce brands, property businesses and services companies who needs leads from PPC. If you're looking for help managing your PPC accounts, Google Ads audits and PPC consulting and training then get in touch for a friendly, non-sales chat.
Odi Caspi - Founder
EffectiveMarketing.uk

 PPC ServicesEcommerce PPCLead Gen PPCGoogle Ads AuditsWalmart Connect PPCDigital Marketing GuidesContact